요청하신 페이지의 적용되는 국가로 리디렉션되었습니다

If you’ve ever had a conversation with a Raman spectroscopist about the feasibility of a low-concentration sensing application, chances are you’ve heard them say “well, Raman may not be sensitive enough…but maybe SERS will work!” But what’s the actual difference between these two techniques, and why is SERS (surface-enhanced Raman scattering, or alternatively surface-enhanced Raman spectroscopy) recommended for low-concentration applications? Let’s explore the technical differences between Raman and SERS spectroscopies, as well as some of the practical considerations for how we regard the data for each.

2021/02/01/raman-vs-sers/4
Figure 1. Normal Raman (a) and SERS (b) scattering of pyridine.

In normal Raman spectroscopy, a laser source is incident directly on a sample (Figure 1a). The laser light is scattered by the bonds of the analyte, and the inelastically scattered light is collected and processed into a Raman spectrum. The non-destructive nature of the technique, the selectivity of Raman bands, and the insensitivity to water make Raman a useful analytical tool for both qualitative and quantitative studies of both organic and inorganic systems.

However, for decades Raman spectroscopy was an underutilized technique in real-world applications. This can be attributed to its two major limitations: 1) the inherent insensitivity of Raman, as only ~1 in 106 incident photons are Raman scattered; and 2) fluorescence emission interference, which depends on the nature of the analyte molecule and the excitation wavelength used. Fluorescence is a competing phenomenon that is much more efficient than Raman scattering, and can thus completely overwhelm the Raman signal.

Though they depend on the scattering strength of the analyte molecule and the sample matrix in question, typical limits of detection for normal Raman scattering can range from ~1–10% in concentration. For certain applications such as disease detection or narcotics identification, this limit may be several orders of magnitude higher than what is required! In this case, an application scientist might recommend a SERS measurement. The hardware required would be the same as for a normal Raman measurement, but different sampling is required for SERS analysis. To understand the difference, let’s discuss a bit about the SERS effect.

In the 1970's, several research groups observed that the Raman signal from organic molecules like pyridine was greatly enhanced when adsorbed to a roughened metallic substrate (Figure 1b) [1–3]. While several theories emerged to account for this observation, it is today generally accepted that the mechanism for enhancement is two-fold: the electromagnetic enhancement mechanism accounts for the dominant contribution, while a chemical mechanism accounts for a smaller portion of the enhancement.

2021/02/01/raman-vs-sers/1
Figure 2.

The electromagnetic enhancement mechanism is enabled by the use of a roughened nanometallic substrate made of a noble metal (usually silver or gold), and the presence of localized surface plasmons, which are quantized oscillations of the valence electrons of the chosen metal. When the laser excites the sample/nanosubtrate complex, it drives the localized surface plasmons into resonance, or excites the “LSPR” (Figure 2).

At this condition, both the laser excitation radiation and the scattered radiation from the sample are amplified. The arrows in Figure 1b are bolded to show this increase in magnitude.

This mechanism can theoretically account for signal enhancement by factors as large as 1011 [4]. The chemical mechanism involves charge-transfers in resonance with the laser excitation wavelength, and typically accounts for a theoretical enhancement factor of up to 104 [5]. Interfering fluorescence can also be quenched by these charge transfers. With the combined enhancement mechanisms we are able to overcome both the inherent insensitivity and fluorescence interference that limits normal Raman scattering. In fact, there are studies which have demonstrated that SERS is able to detect single molecules [6,7]!

Fabrication of these nanostructures has been an increasing area of academic research in the last two decades. SERS substrates can include colloidal suspensions, solid nanospheres, and metal coated on silicon chips. The enhancement tends to be at its height when the analyte molecule is placed at a junction of nanostructures (otherwise known as a SERS “hotspot”), so researchers can tailor the shapes and the plasmonic activity of these substrates to reach even greater levels of enhancement for their research purposes.

Metrohm offers commercial SERS substrates that are available for purchase to use for real-world applications. These substrates are designed to be easy-to-use, flexible, and low-cost. Both paper-based SERS substrates and nanoparticle colloidal solutions are available. An introductory SERS Kit containing both types of materials is also offered.
 

Paper-based substrate

Silver nanoparticles

SERS Discovery Kit


After discussion with an application scientist, users may determine that a commercially available SERS substrate is suitable for their application. However, in others greater sensitivity may be required to meet the limits of detection for the application. In this case, local university labs who work on nanofabrication may be able to collaborate on measurements.

2021/02/01/raman-vs-sers/2
Figure 3. Raman and SERS spectra of fentanyl HCl. (a) Normal Raman spectrum and (b) SERS spectrum.

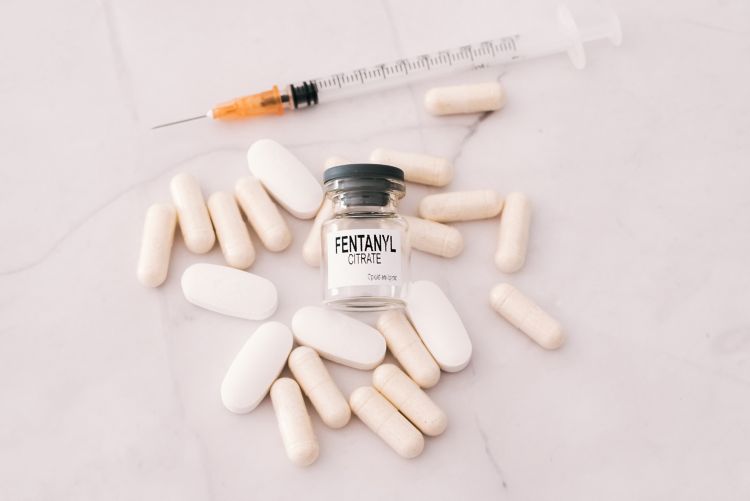
We often get questions such as “Can we use our existing Raman reference library to analyze our SERS spectrum?” Figure 3 shows the difference between a normal Raman spectrum of fentanyl HCl and a SERS spectrum of a saturated solution of fentanyl HCl on a commercial SERS substrate.

The normal Raman spectrum for fentanyl contains significantly more peaks than the corresponding SERS spectrum. The SERS bands are also noticeably broader than the normal Raman bands. In the case of the SERS spectra, it is not solely the vibrational modes of the molecule that are being probed, but the sample as adsorbed to the substrate. Hence, we may also observe some peaks in a SERS spectrum that can be attributed purely to the substrate. 

Because of the differences between a SERS spectrum and a normal Raman spectrum, it may be difficult in some cases to use commercial Raman libraries for analysis of SERS spectra. We encourage users who require SERS identification to create their own SERS spectral databases using their substrates. We also include SERS-specific narcotics libraries on some of our TacticID handheld Raman products. For more complicated data analysis, there is also an expansive SERS literature base to draw on.

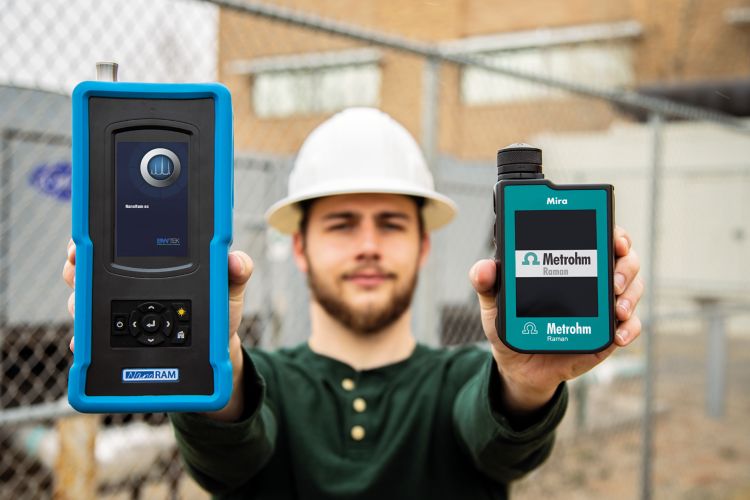
TacticID handheld Raman instruments


In low-concentration sensing applications, or instances where fluorescence overwhelms your Raman signal, SERS is an invaluable technique for both researchers and real-world problem solvers alike. For more information, visit our website.

B&W Tek SERS solutions

Your knowledge take-aways

Learn more about SERS

References

[1] D.L. Jeanmaire and R.P. Van Duyne, J. Electroanal, Chem84, 1–20 (1977).

[2] M.FleischmannP.J.Hendra, and A.J. McQuillanChem. Phys. Lett. 26, 163-166 (1974).

[3] M.G. Albrecht and J.A. Creighton, J. Am. Chem. Soc. 99, 5215-5217 (1977).

[4] J.P  Camden J. A. DieringerY. WangD.J. MasielloL.D. MarksG.C. Schatz, and R.P. Van DuyneJ. Am. Chem. Soc. 130, 12616–12617 (2008).

[5] R. Pilot, R. Signorini, and L Fabris, “Surface-Enhanced Raman spectroscopy: Principles, Substrates, and Applications”. In: Deepak F.L., editor. Metal Nanoparticles and Clusters: Advances in Synthesis, Properties and Applications. Springer; Cham, Switzerland: 2018. pp. 89–164.

[6] J.A. Dieringer, R.B. Lettan, K.A. Scheidt, and R.P Van Duyne, J. Am. Chem. Soc.129, 16249–16256 (2007).

[7] K. Kneipp, Y. Wang, H. Kneipp, L.T. Perelman, I. Itzkan, R.R. Dasari, and M.S. Feld, Phys. Rev. Lett. 78, 1667-1670 (1997).

문의하기

B&W Tek, a Metrohm Group Company

Plainsboro, NJ, USA

문의하기